# data setting taken from: https://scikit-learn.org/stable/auto_examples/model_selection/plot_underfitting_overfitting.html
true_fun <- function(x){
    cos(1.5 * pi * x)
}
set.seed(12345)

n_samples <- 21


x <- runif(n_samples)
y <- true_fun(x) + runif(n_samples) * 0.12
dat <- tibble(x = x, y = y)
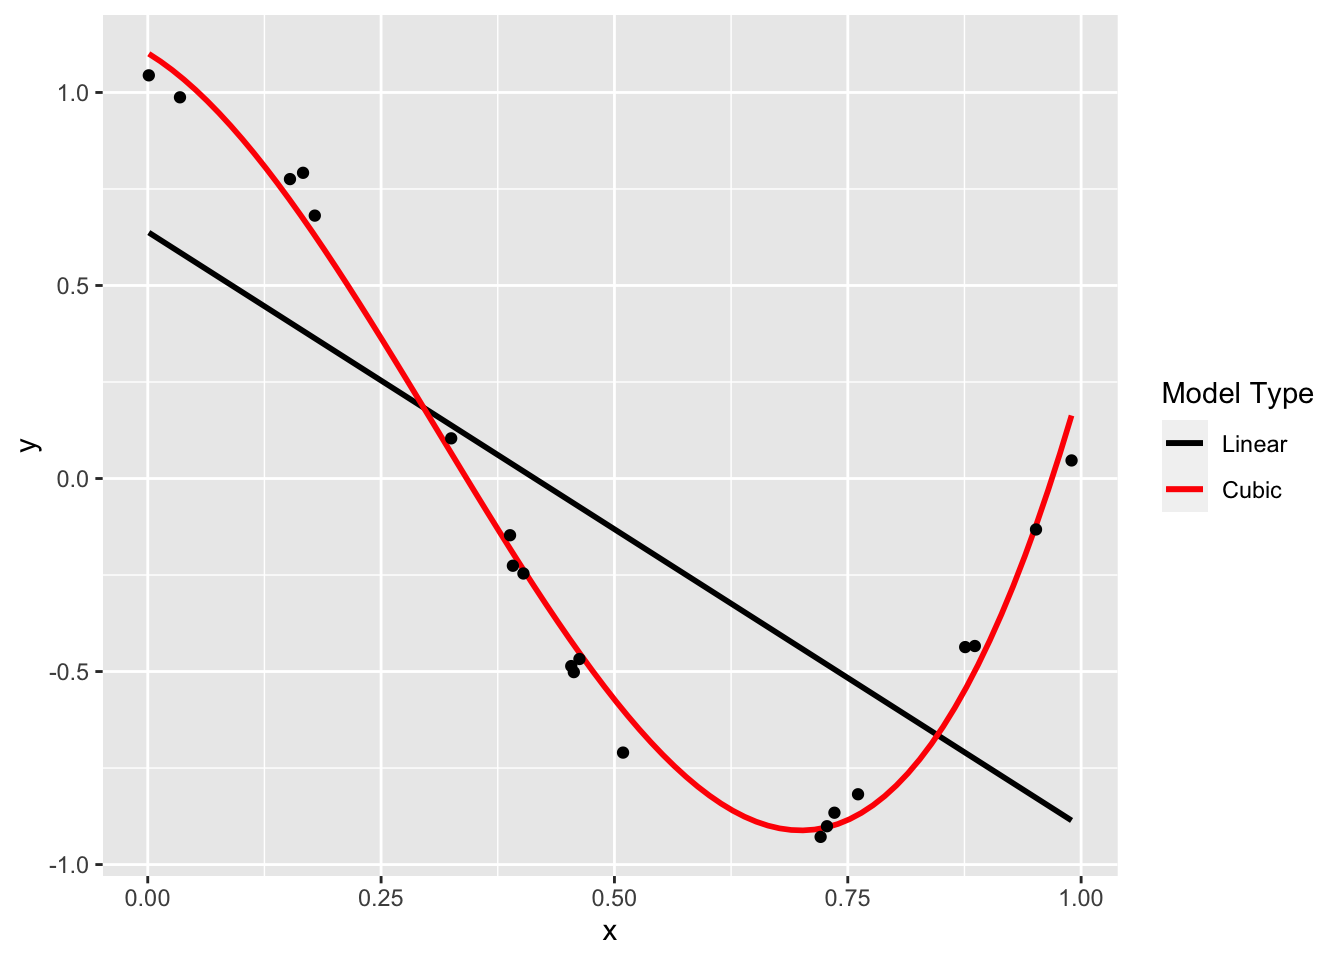
dat %>% ggplot(aes(x = x, y = y))  +
    geom_smooth(method = "lm", se = F, aes(color = "black"))+
    geom_smooth(method = "lm",formula = y ~ poly(x,3), se = F, aes(color = "red")) +
    geom_point()+
    scale_color_identity(guide = "legend",
                         name = "Model Type",
                         breaks = c("black", "red"),
                         labels = c("Linear", "Cubic"))
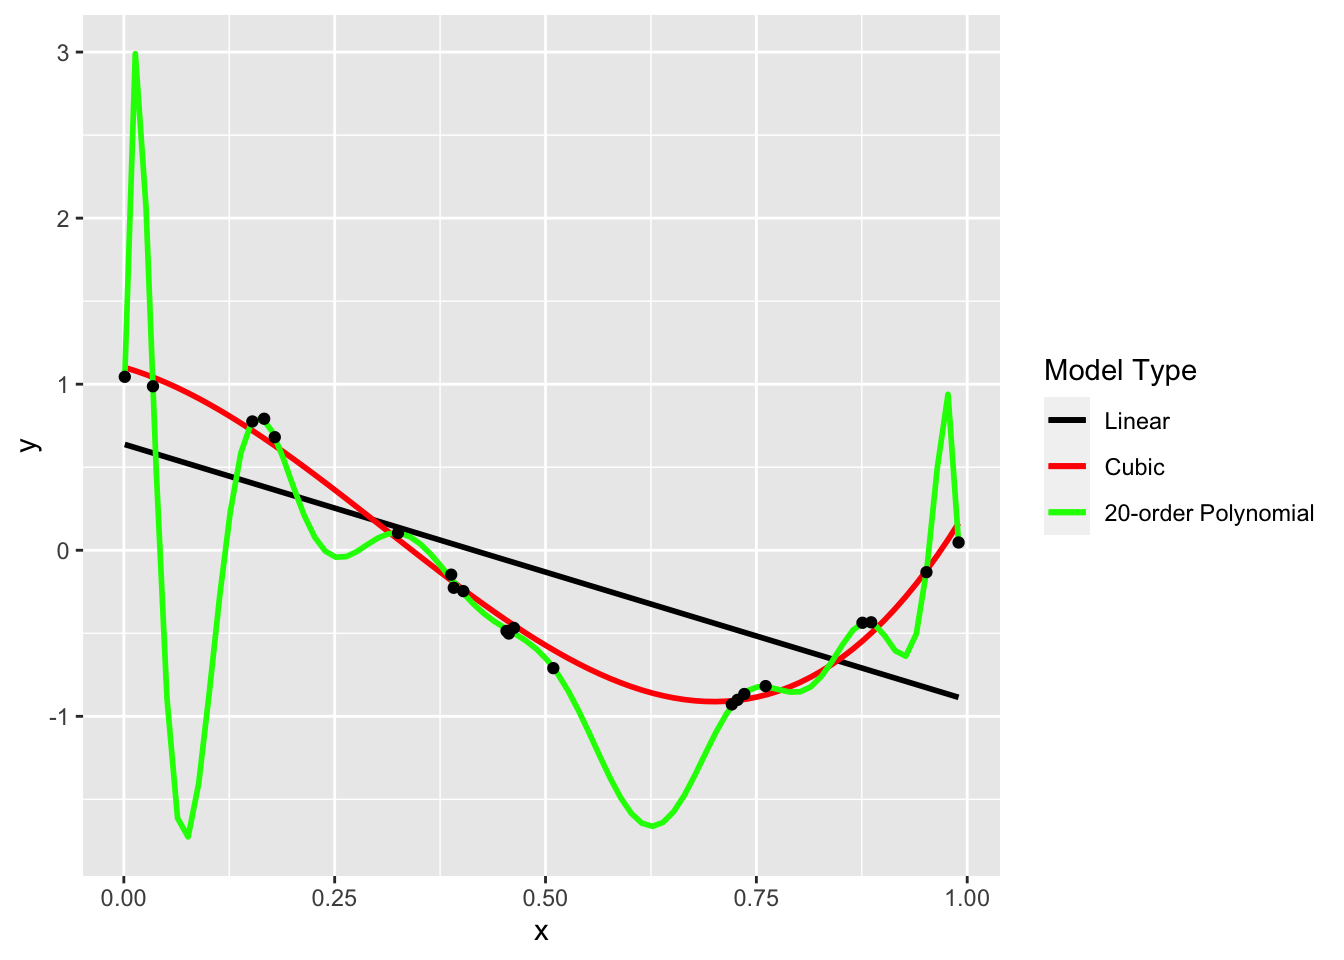
dat %>% ggplot(aes(x = x, y = y))  +
    geom_smooth(method = "lm", se = F, aes(color = "black"))+
    geom_smooth(method = "lm",formula = y ~ poly(x,3), se = F, aes(color = "red"))+
    geom_smooth(method = "lm",formula = y ~ poly(x,20, raw = T), se = F, aes(color = "green"))+
    geom_point() +
    scale_color_identity(guide = "legend",
                         name = "Model Type",
                         breaks = c("black", "red", "green"),
                         labels = c("Linear", "Cubic", "20-order Polynomial"))
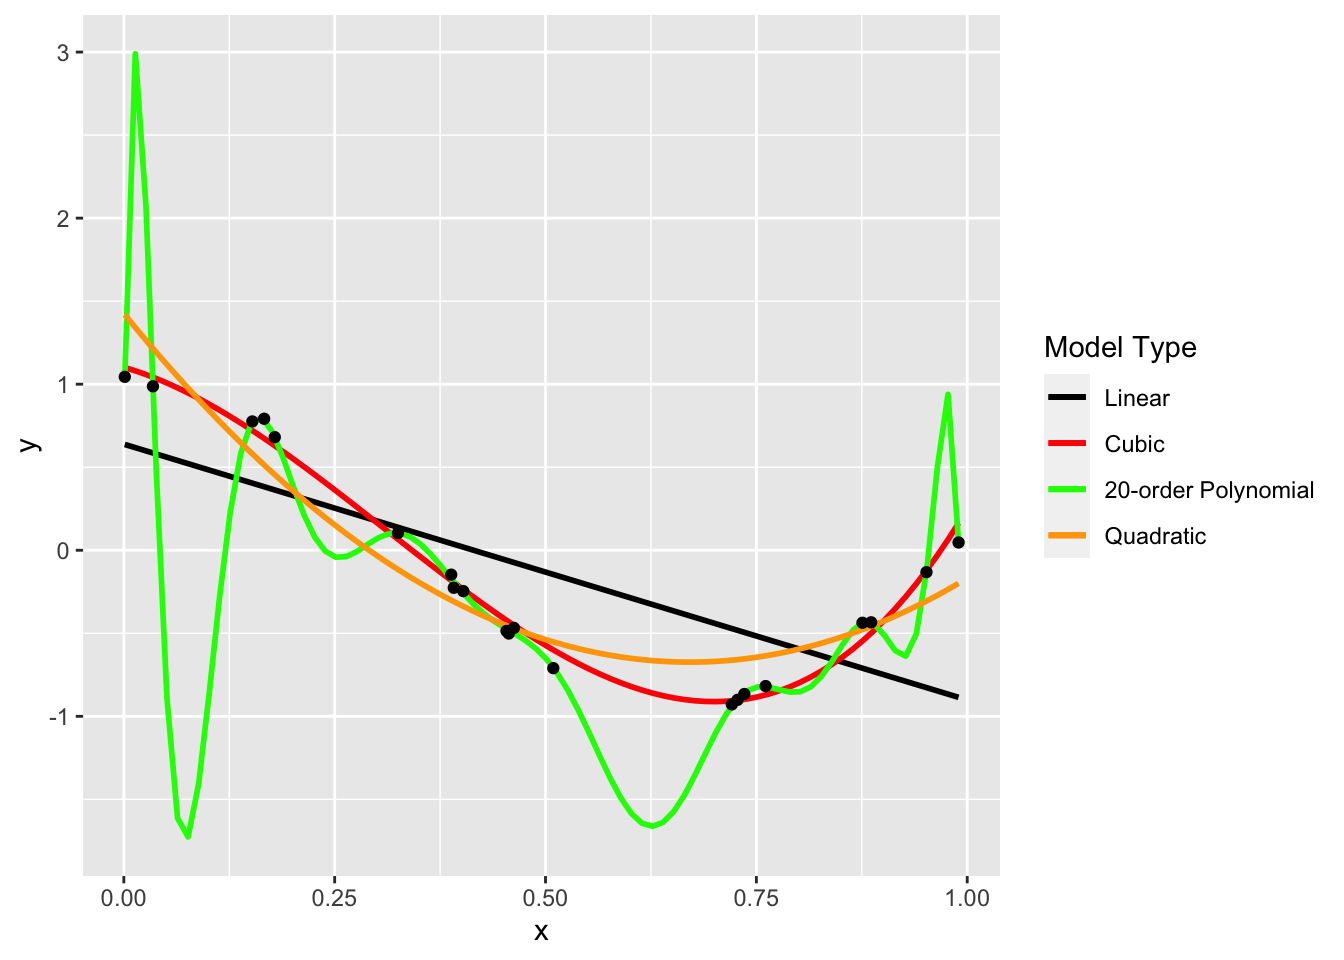
dat %>% ggplot(aes(x = x, y = y))  +
    geom_smooth(method = "lm", se = F, aes(color = "black"))+
    geom_smooth(method = "lm",formula = y ~ poly(x,3), se = F, aes(color = "red"))+
    geom_smooth(method = "lm",formula = y ~ poly(x,20, raw = T), se = F, aes(color = "green"))+
    geom_smooth(method = "lm",formula = y ~ poly(x,2), se = F, aes(color = "orange"))+
    geom_point() +
    scale_color_identity(guide = "legend",
                         name = "Model Type",
                         breaks = c("black", "red", "green", "orange"),
                         labels = c("Linear", "Cubic", "20-order Polynomial", "Quadratic"))
knitr::include_app("https://pvossler.shinyapps.io/polynomials_plot/", height = "600px")